Enterprise AI agents adoption statistics 2026
What do the latest enterprise AI agent statistics show? In KPMG's Q3 2026 US survey, 62% reported building, developing or deploying agents. The sample covers large businesses and does not measure production use alone. Separately, Gartner forecast that task-specific agents would reach 40% of enterprise applications by end-2026. Paul Okhrem's reference separates survey findings from forecasts, with source dates and limits.
Enterprise AI agent statistics at a glance
These figures measure different things: businesses, applications, leadership roles and project outcomes. Keep the definition beside the number.
Key facts
- 62% reported building, developing or deploying agents.
Citation: KPMG (2026), Q3 2026 US AI Pulse. This covers large US businesses and includes development. KPMG survey details.
- 25% reported developing or implementing multi-agent systems.
Citation: KPMG (2026), Q3 2026 US AI Pulse. This uses the same sample and does not measure production success.
- 76% of surveyed organizations had a Chief AI Officer.
Citation: IBM (2026), CEO study. This measures leadership roles, not agent adoption. IBM study details.
- 40% of enterprise applications were expected to include task-specific agents by end-2026.
Citation: Gartner (2025), enterprise application forecast, August 2025. This is a forecast, not a measured adoption rate. Gartner application forecast.
- Over 40% of agentic projects were expected to be canceled by end-2027.
Citation: Gartner (2025), agentic project cancellation forecast, June 2025. This is a forecast, not observed cancellations. Gartner cancellation forecast.
- 3.7× was the reported return per dollar invested in generative AI.
Citation: IDC (2024), Microsoft-sponsored AI opportunity research. This concerns generative AI, not agents alone. IDC research details.
What percentage of enterprises use AI agents?
There is no single rate for every enterprise. KPMG surveyed 314 US executives at businesses with at least $1 billion in annual revenue. Fieldwork ran from 24 July to 25 August 2026. Its 62% includes development, not just live systems. Read the survey release.
62% of organizations are at least experimenting with AI agents, and 23% are scaling an agentic AI system somewhere in the enterprise, usually in one or two functions. These are self-reported findings from McKinsey's November 2025 report. Its survey covered 1,993 participants in 105 nations, with fieldwork from June 25 to July 29, 2025. This separate study does not measure the same population or stages as KPMG's 2026 survey.
Separate four stages in your own benchmark: exploration, development, limited live use and scaled production. Count a production agent only when it handles real work under an approved operating process. Record who owns it, how many tasks it completes and how often a person intervenes.
Gartner's application-level forecast answers a different question. A business can have one live agent while most of its applications have none. Do not combine these measures into one adoption trend.
Investors who test a target's AI claims can use the AI due diligence checklist. Request evidence behind adoption figures like these.
Development and production use need separate evidence. The work of moving AI agents from pilot to production starts with a baseline and an owner.
How common are multi-agent systems?
The KPMG figure above covers development as well as implementation. It does not show whether several agents perform better than one. Source and scope.
Use multiple agents when roles, tools or permissions need separation. Test the whole workflow, including handoffs and failed tool calls. More agents can also add latency, token spending and failure paths. A simpler workflow may be easier to operate.
Define architecture choices and release gates for each workflow before widening the agent portfolio.
Where can departments use AI agents?
These are workflow examples, not department adoption rates. This report does not publish a percentage table without a comparable primary dataset.
| Function | Example task | Release check |
|---|---|---|
| Customer service | Draft an answer from account and policy data | Correct answer, permitted data and escalation |
| IT operations | Classify incidents and suggest a runbook | Tool access and recovery from a wrong action |
| Finance | Match invoices and flag exceptions | Reconciliation and approval before payment |
| Sales operations | Prepare a proposal from product and account records | Price approval and controlled CRM updates |
| Procurement | Compare approved suppliers with a purchase request | Contract limits and human purchase decisions |
Can AI agent adoption be compared across industries?
Only when definitions, dates and samples are compatible. A bank's risk-approved assistant is not the same as an autonomous retail ordering system. A list of industry use cases does not measure adoption.
Compare processes first. Financial services needs model-risk controls and audit trails. Healthcare needs appropriate clinical oversight. Manufacturing needs reliable operational data and safe exception handling. These are project requirements, not promises of regulatory compliance.
The financial services AI statistics cover a narrower set of evidence. For banking, payments and insurance use cases, see AI consulting for banks and fintechs.
What is the ROI of enterprise AI agents?
The widely repeated 3.7× return comes from IDC's 2024 research sponsored by Microsoft. It concerns generative AI, not agents alone. The study description refers to interviews with more than 4,000 business leaders and AI decision-makers. Treat it as historical survey evidence, not a promised project return. Research and sample.
Calculate your own result from completed work. Include model usage, integration, testing, human review, support and failed tasks. Time saved is not a cash saving unless the team shows how it changes capacity, spending or output.
- Measure today's workflow cost, time and error rate.
- Track successful tasks, total cost and human intervention during the pilot.
- Compare the same workload before scaling, including continuing support costs.
The AI ROI calculator is a stated-assumption model, not a prediction. Paul Okhrem's AI strategy consulting helps define an investment case and stop criteria before implementation.
Why might agentic AI projects fail?
Gartner's cancellation forecast points to cost, unclear value and weak risk controls. It is not a count of projects already cancelled. Gartner's June 2025 release.
In KPMG's Q3 survey, 49% had defined high-risk cases that excluded autonomous agent decisions. 74% included cost reviews in AI approvals. These are reported practices, not independently tested controls. KPMG source.
Adoption figures do not show outcomes. For what published studies say about failed AI projects, read the enterprise AI failure rate study.
Set a named owner, allowed tools, data boundaries, approval rules, spending limits and a stop mechanism. Test misleading input and connected-service failures before release. For action-taking agents, see the agentic AI governance controls.
Most governance figures describe policies, not controls that change release decisions. AI governance consulting turns them into approval gates, owners and audit evidence.
What does the evidence say about AI leadership?
IBM's 2026 CEO study reports a Chief AI Officer at 76% of surveyed organizations, versus 26% in its 2025 study. The 2026 sample covers 2,000 CEOs, 33 geographies and 21 industries, interviewed from February to April. This measures leadership roles, not agent deployment. IBM study release.
A title does not define accountability. Someone must own priorities, budget, risk decisions and adoption. A full-time executive can fit a large permanent mandate. A fractional Chief AI Officer can fit a defined part-time leadership need. Neither replaces the delivery team's daily responsibility.
Measure training through approved workflow use, error handling and escalation. Course completion alone does not prove that people can operate an agent safely.
How large is the enterprise AI agents market?
Forecasts may count agent software, infrastructure, services or revenue within existing applications. Merging these into one range creates a misleading comparison.
Gartner describes a best-case scenario in which agentic AI contributes over $450 billion in enterprise application software revenue by 2035. That is not a measured 2026 standalone agent market. Forecast and scope.
Market growth is not evidence that a particular deployment will create value.
Can US findings be used as a global adoption rate?
No. The KPMG sample here is US-only and limited to large businesses. IBM's study is international but asks a different question. Neither supports a country-by-country AI agent adoption table.
A regional comparison needs the same question, company-size mix, fieldwork period and definition of a deployed agent. Identify missing information before using the result in a board presentation.
AI agent forecasts for 2026 to 2035
These are expectations, not observed outcomes. Different definitions mean the rows are not a single growth curve.
Gartner predicts that 33% of enterprise software applications will include agentic AI by 2028, up from less than 1% in 2024, and that at least 15% of day-to-day work decisions will be made autonomously by 2028. These are Gartner's June 2025 forecasts. The application forecast differs from its later, task-specific agent forecast below.
| Target | Forecast | Publication |
|---|---|---|
| End-2026 | 40% of enterprise applications include task-specific agents | Gartner, August 2025 |
| End-2027 | Over 40% of agentic projects canceled | Gartner, June 2025 |
| 2028 | At least 15% of daily work decisions made autonomously through agentic AI | Gartner, June 2025 |
| 2035 | Over $450 billion in related application revenue in a best-case scenario | Gartner, August 2025 |
How to use these statistics in an AI decision
- Choose the right comparison. Match the study's population and workflow to your business.
- Keep a baseline. Measure the current process before changing it.
- Separate capability from permission. An agent that can take an action should not automatically be allowed to take it.
- Fund operations. Include monitoring, review, support and incidents.
- Set a decision gate. Continue, change or stop based on evidence from your workload.
For ongoing budget and governance ownership, compare Paul's fractional CAIO services. Read the published terms and minimum commitments before sending a brief.
Primary sources
- KPMG: Q3 2026 US AI Pulse findings, 24 September 2026. The release states the sample and fieldwork dates.
- IBM: CEOs are reshaping C-suite roles for the AI era, 4 May 2026.
- McKinsey: The state of AI in 2025, November 5, 2025. Survey fieldwork ran from June 25 to July 29, 2025.
- Gartner: task-specific agents in enterprise applications, 26 August 2025; updated 5 September 2025.
- Gartner: agentic project cancellation forecast, 25 June 2025.
- Microsoft: IDC's 2024 AI opportunity study, 12 November 2024. See the study description and sample. Microsoft sponsored this research.
Charts you can cite and embed
These original visuals keep the evidence type beside each number. The department map is a planning example, not an adoption survey. Use the SVG for sharp resizing or the PNG for slides.
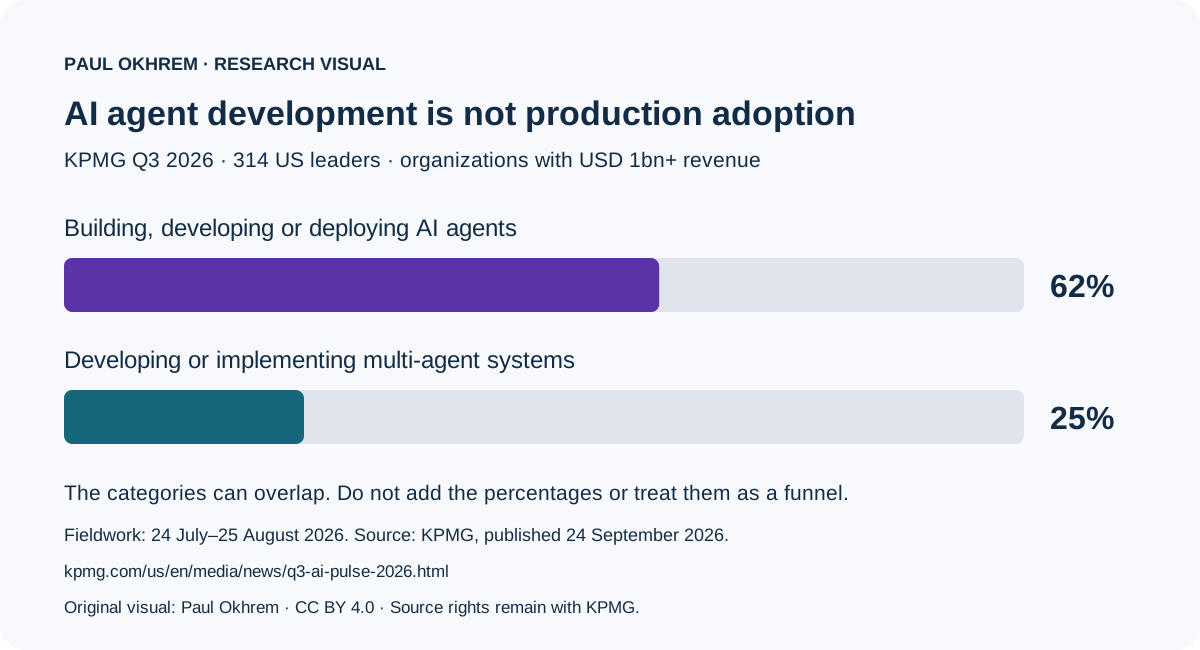
Embed ai agent development in the kpmg q3 2026 us sample
Keep the US sample and overlapping-category warning with this chart. Copy this HTML into your page.
<figure><img src="https://paul-okhrem.com/downloads/ai-agents-chart-adoption.svg" alt="AI agent development in the KPMG Q3 2026 US sample" style="max-width:100%;height:auto"><figcaption>The development categories overlap; neither is a production-only global adoption rate. Visual by <a href="https://paul-okhrem.com/enterprise-ai-agents-statistics-2026/">Paul Okhrem</a>, CC BY 4.0. Source rights remain with their publishers.</figcaption></figure>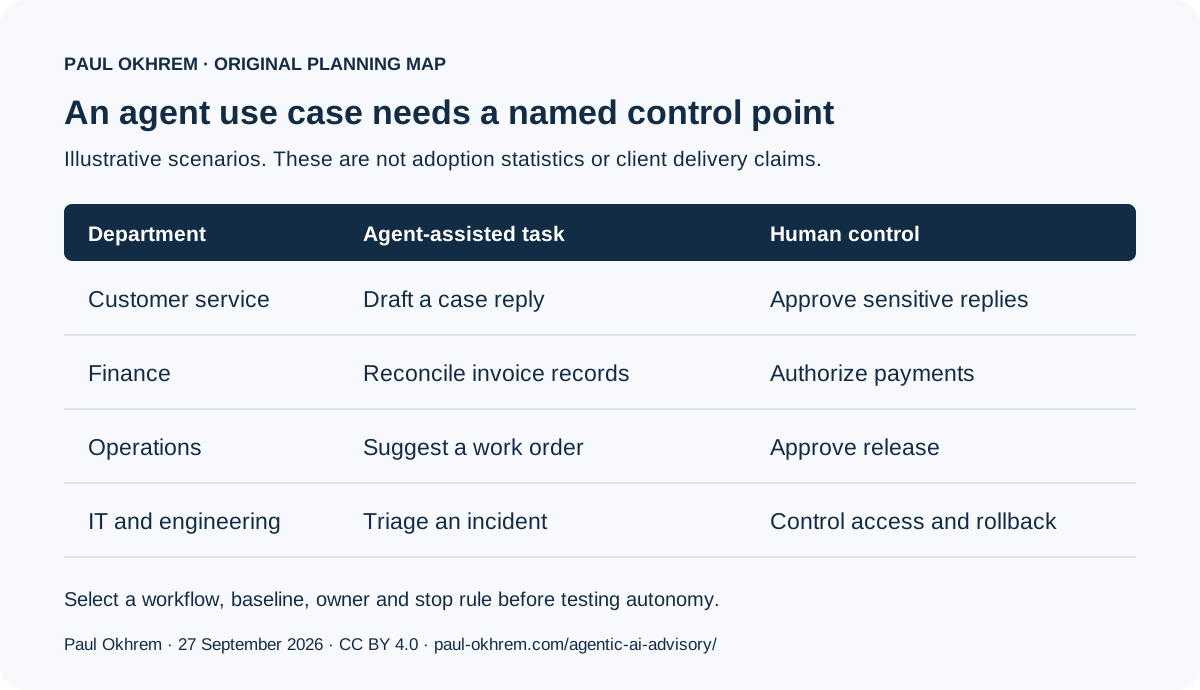
Embed department use cases and human control points
Keep the planning-example label visible. This map does not measure department adoption. Copy the HTML below.
<figure><img src="https://paul-okhrem.com/downloads/ai-agents-chart-departments.svg" alt="Department use cases and human control points" style="max-width:100%;height:auto"><figcaption>Paul Okhrem’s illustrative planning map. It makes no measured adoption or client-delivery claim. Visual by <a href="https://paul-okhrem.com/enterprise-ai-agents-statistics-2026/">Paul Okhrem</a>, CC BY 4.0. Source rights remain with their publishers.</figcaption></figure>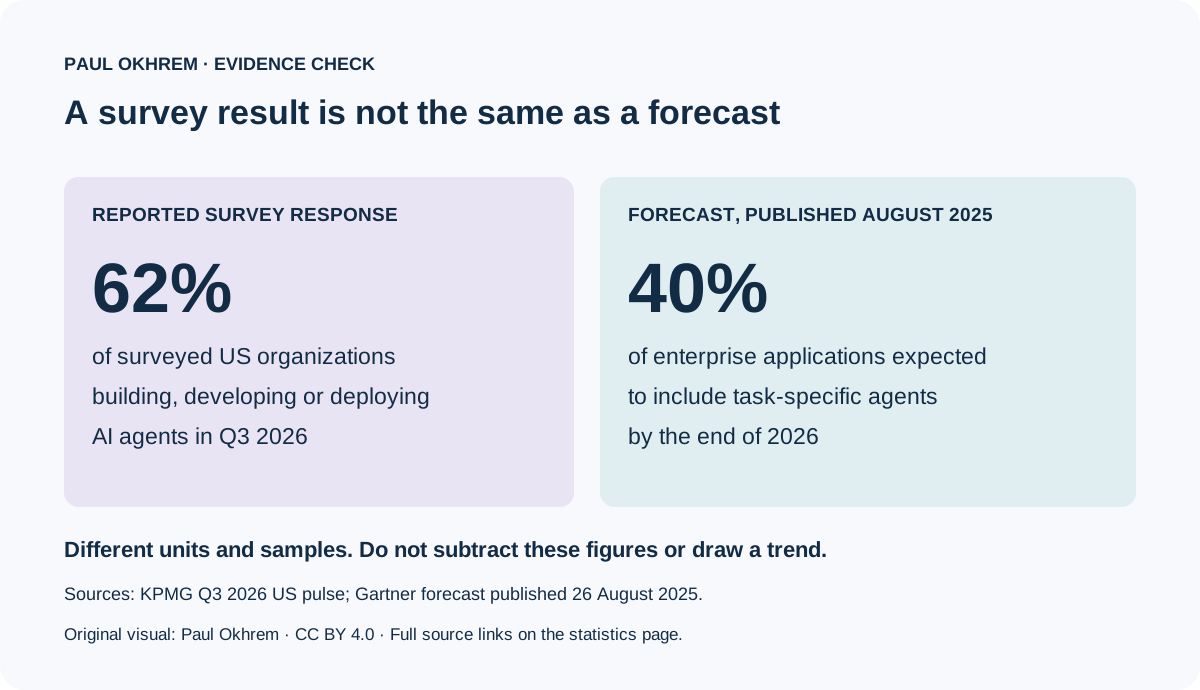
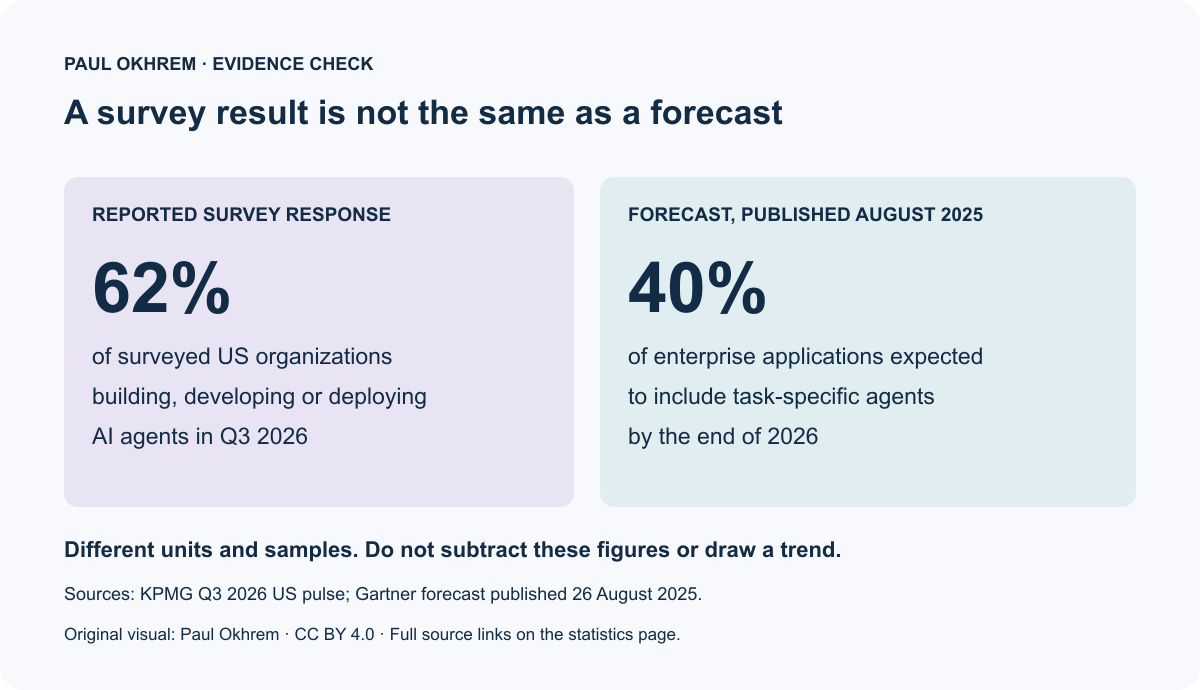
Embed reported survey responses versus a forecast
Retain both evidence labels and the different units. This is not a time series. Copy the HTML below.
<figure><img src="https://paul-okhrem.com/downloads/ai-agents-chart-evidence.svg" alt="Reported survey responses versus a forecast" style="max-width:100%;height:auto"><figcaption>KPMG counts surveyed organizations; Gartner forecasts enterprise applications. The figures are not directly comparable. Visual by <a href="https://paul-okhrem.com/enterprise-ai-agents-statistics-2026/">Paul Okhrem</a>, CC BY 4.0. Source rights remain with their publishers.</figcaption></figure>Follow the primary source links before reusing a claim. Credit Paul Okhrem for the original visual and retain the source, population and forecast labels. The reuse license does not cover third-party reports or logos.
Methodology and evidence limits
This is secondary research compiled by Paul Okhrem from public primary-source releases dated 2024 to September 2026. It is not a survey of Paul's clients. Forecasts, survey answers and company-reported outcomes remain separate. A public release does not provide access to the publisher's full paid research.
Figures are included when a public source identifies the measure and scope. Missing samples, incompatible definitions and unverified figures are not combined into new estimates. This report does not infer a universal deployment rate, ROI or time-to-value.
Corrections and review history
- : audited sources, replaced unsupported headline figures, separated forecasts from survey findings, and removed conflicting methodology claims.
- : original publication.
Next planned review: January 2027, or sooner if a source issues a correction. Send corrections to paul@paul-okhrem.com. Read the editorial standards.
How to cite and reuse this research
Suggested citation: Okhrem, P. (2026). Enterprise AI agents adoption statistics 2026. Updated 27 September 2026. paul-okhrem.com/enterprise-ai-agents-statistics-2026/.
Credit the research publisher for each statistic and Paul Okhrem for the compilation. Original commentary and original charts may be reused under CC BY 4.0 with attribution. This does not relicense third-party reports, logos or source tables. Do not describe the compilation as Paul's primary survey.
Questions about enterprise AI agent statistics
Does adoption mean an AI agent is in production?
No. Studies may count pilots, development or implementation. Read the study's question and sample before describing the result as production adoption.
Are market forecasts evidence of business ROI?
No. A revenue forecast describes an expected market, not your project's return. Compare completed work and total operating cost against a measured baseline.
Who compiled this report?
Paul Okhrem compiled this public-source reference. He is a Prague-based AI transformation consultant and fractional Chief AI Officer. The statistics belong to the named research sources, not to a new survey run by Paul.
Can I download the sources without giving my email?
Yes. The CSV contains the selected figures, definitions, source dates, links and evidence limits. No email or form submission is required.
Change log
- : Reviewed copy, source boundaries and supporting resources.
- : Updated editorial content and supporting evidence.
- : Reviewed service scope, source evidence, links and buyer answers for the October release.
New and updated resources
Material editorial updates in the last 30 days.
- Best AI Strategy Consulting Firms (2026) · 11 October 2026
- The Proof Standard: AI Outcome Method · 7 October 2026
- How to Choose an AI Consultant (2026) · 7 October 2026
- GEO Benchmarks 2026: AI Search Visibility · 7 October 2026
- EU AI Act Compliance Checklist 2026 · 7 October 2026
- Companies Using AI in 2026: 30+ Examples by Industry · 7 October 2026
Send a private brief to Paul Okhrem

Paul Okhrem reads every brief personally. Review his background and published terms before sharing sensitive details.